
People create data in everything they do. Sketching a building. Drilling a hole for piles. Placing a glass-pane window. Only recently has it been possible to capture that data in precise and vast measures. But what does one do with all that data? How can one use it to their advantage?
“We can now analyze everything in far greater detail,” said Mads Jensen, CEO of Sefaira, in Randy Deutsch‘s Data-Driven Design and Construction: 25 Strategies for Capturing, Analyzing,and Applying Building Data. “Thereby [we can] use the analysis of our design data to actually shape the next design decision.”
Analyzing things in far greater detail and applying that to the next design decision is just one way designers can leverage data. Listed here are five of the biggest benefits of data-driven design.
1. AUTOMATE THE DESIGN PROCESS
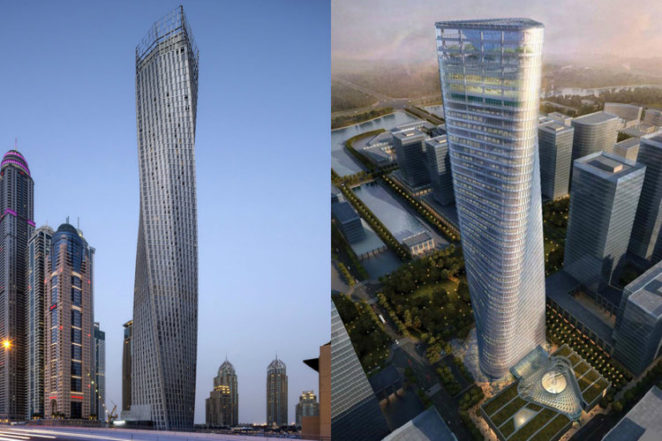
In Data-Driven Design and Construction: 25 Strategies for Capturing, Analyzing,and Applying Building Data, senior digital manager at Skidmore, Owings and Merrill (SOM) Robert Yori said, “Some of our recent work echoes an effort we’ve undertaken in analog form in year past.” They can design buildings similar to others built based on their collected data. For example, “if a client [goes to SOM] and says, ‘I really love that project you did in midtown Manhattan. Can you do something similar for our site in China?’, [SOM architects] can begin to analyze [their] building’s key design metrics almost instantaneously.”
2. DESIGN BASED ON THE LOCATION
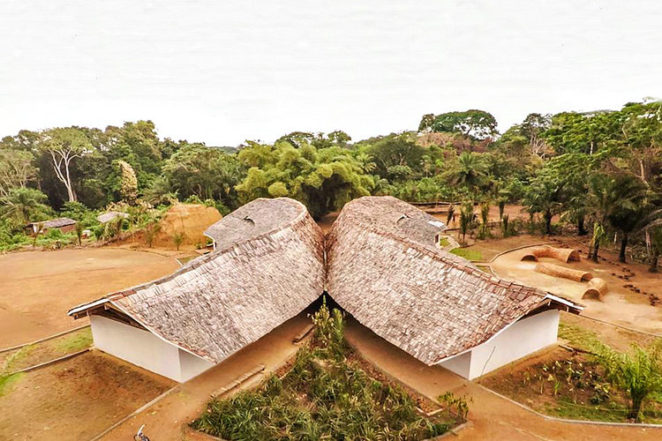
Data exists everywhere — even in places one might not suspect. Architects can use that locational data and leverage it in their design. MASS Design Group, for example, has taken data found in African communities (i.e. primary and seconary users of a building, materials available, climate) and built schools and hospitals for these communities that fit, and benefit, that environment.
3. FOCUS ON SUSTAINABILITY

With nearly 20 awards, many based on sustainability, the Bullitt Center in Seattle remains to be one of the most notable green office buildings in the world. It’s net-zero energy, net-zero water, and Living Building certified. To create this design, a multi-disciplinary team of architects, environmental scientists, hydrologists, botanists, software developers, and engineers gathered and shared data and, then, ran it through building information models. They vetted each material used in the building to see how it would impact the users and environment.
4. IMPROVE THE USER EXPERIENCE

Another source of valuable information — building users. Buildings, first and foremost, serve the people who use them. Using collectivized data on user feedback can help architects improve the experience for those (and future) individuals. When expanding The University of Texas MD Anderson Cancer Center Alkek Tower, designers at HSK Architects took into account the patients, staff, and visitors’ experience to create better circulation, wayfinding, and an overall warmer environment. “The expansion of the Alkek Hospital was designed to foster [collaboration, coordination of care, and] focus on the patients and their families. The environment is warm and inviting and encourages healing. It’s what our patients expect and deserve,” said Janet Sisolak, project director at The University of Texas MD Anderson Cancer Center.
5. CONTINUE LEARNING FROM EACH PROJECT
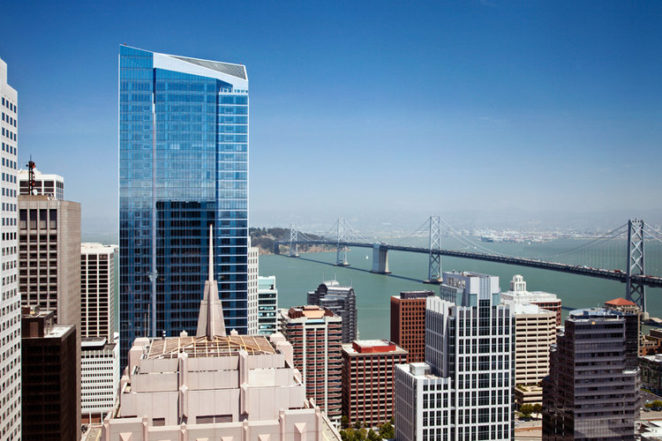
For every building constructed, a massive amount of data is created. Designers take this information, analyze it, and learn what worked and, in some cases, what didn’t. Take Millennium Tower in San Francisco, for example. Initially expected to evenly settle approximately six inches over its lifetime, the 58-story residential building has already sunk 12-16 inches (leaning 15 inches at the top to the northwest) since completion in 2009. The tower rests on 950 friction piles, which, by design, don’t touch bedrock. This foundation method has held up many times before. This time, however, it didn’t. By analyzing data created from the project (and from the surrounding environment), structural and architectural designers can determine (or hypothesize) what external or internal forces caused the structure to not settle as planned, and they can use their findings to prevent something like this to reoccur.
Interested in data-driven design? Join us on May 24, 2017 for our next BuildIdeas! Breakfast.

Discussion
Be the first to leave a comment.
You must be a member of the BuiltWorlds community to join the discussion.